Safety Diode Thyristor Transistor Triac
Opamp
Target Preparing Experimentation Report Problems
Laboratory target
Acquainting with amplitude and phase frequency responses and waveforms of a non-inverting voltage amplifier with negative feedback built on the operational amplifier (opamp) and finding the opamp bandwidth.
Lesson preparation
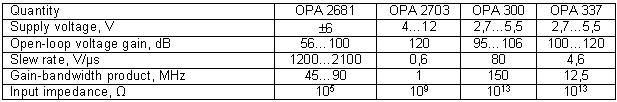
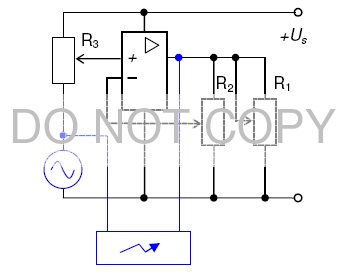
- Using the figure and the datasheet below, find the opamp data: type, supply voltage, open-loop voltage gain, slew rate, gain-bandwidth product, and input impedance. Acquire with the tuning knobs and plugs of the test board. Find the output potentiometer R1, the feedback potentiometer R2, the input potentiometer R3, the signal inputs 1, 2, and the output 3.
- Study the available power and signal sources: their types, voltage shapes, maximum voltage Us max, and maximum current Is max.
- Develop the circuit diagram to study amplitude and phase frequency responses and voltage waveforms of a non-inverting voltage amplifier with negative feedback built on the opamp. Provide the circuit link-up with the power source, signal generator on the input (1), and oscilloscope on the input (2) and output (3) of the amplifier.
- Draw expected frequency responses and voltage waveforms of the voltage amplifier.
Experimentation
- Assemble the desired circuit to estimate the input and output waveforms. Self-examine the assembled circuit and ask the instructor to examine it.
- Switch on the power source and set the voltage of 10 V. Ensure the circuit operates properly. If the fault occurs in any instant, power off the lab bench immediately, examine the circuit and eliminate errors.
- Switch on the signal generator and the oscilloscope. Set the sinusoidal waveform of the signal generator with the frequency of 100 Hz and attenuation around 50 dB (30 − 300 mV).
- Set given feedback level and the maximum output sinusoidal signal of the amplifier using the input and output potentiometers. Measure the input Upp in and the output Upp out peak-to-peak signal values and fill them in the protocol.
- At the fixed input, smoothly increase the signal generator frequency f and make measurements of the output peak-to-peak voltage Upp out at every 5 % increase of the time shift f between input and output waveforms while they keep the sinusoidal shape. Pay the particular attention to the 25 % time shift of the period (45°) where the bandwidth ends.
- Following the instructor’s permission, power off the devices, take off the circuit, and introduce proper order in the workplace.
Report contents
- Circuit diagram of the studying circuit, with specification of the components.
- Bandwidth estimation and calculation example of the voltage amplification factor Ku and the phase shift φ at the cutoff frequency.
- Table of the observed and calculated data at the given input (Upp in) and feedback signals: f, Upp out, φ [μs] and the calculated values Ku and φ°.
- Scaled diagrams of the amplitude Ku (f) and phase φ°(f) frequency responses.
- Input and output voltage waveforms at the cutoff frequencies.
- Conclusions regarding estimation, comparison and explanation of the expected and obtained results.
- Signed protocol.
Optional section
- Set a couple of other feedback levels and repeat the abovementioned experiment. Build the graph of the bandwidth dependence upon the feedback fraction.
- Set the triangle signal and repeat the experiment. Make the conclusion about the bandwidth dependence on the signal shape.
- Define experimentally the frequency and voltage bands within which the opamp is a linear device. Build the input and output voltage waveforms of the non-linear opamp operation. Make the conclusion about non-linearity reasons and results.
Safety Diode Thyristor Transistor Opamp Triac